Dashboard
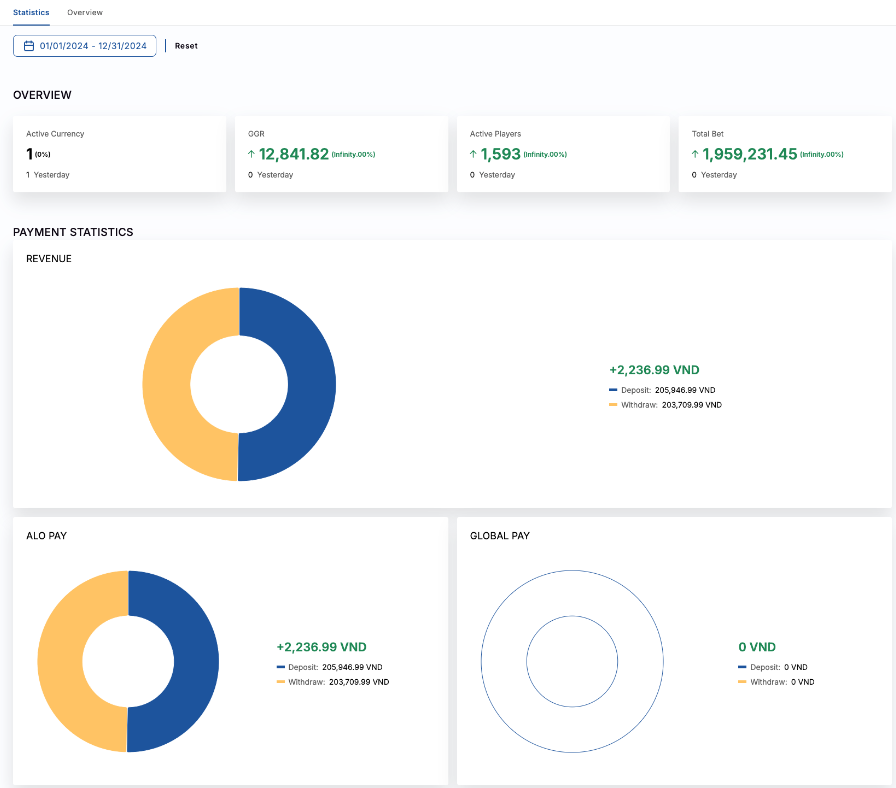 Dashboard provides a general view about the Business performance of the Customers.
There are 2 main sections of Dashboard:
- Statistics: the information about Player, GGR and Payment.
- Overview: the charts of GGR, Player and Game.
Statistics
Overview
 The Overview statistics will display:
- Active Currency: the quantity of Currencies that have been used by Players for gaming.
- GGR: the number of Gross Gaming Revenue.
- Active Players: the total Players who are making bet currently.
- Total Bet: the total Betting amount from Players.
The data of Overview section could be displayed in: 1 day, 1 week and 1 month by clicking on the filter.
Payment Statistics
Revenue
 The Revenue displays the different of Total Deposit and Total Withdraw amount in a period of time.
- The Operator can view the data in the expected currency by clicking on the filter "Show In" and change the currency. After change the currency, the data of Payment Statistics will apply that currency
- Beside that, Operator can select the expected ranges of time to view the data by clicking on the Date time filter.
Providers
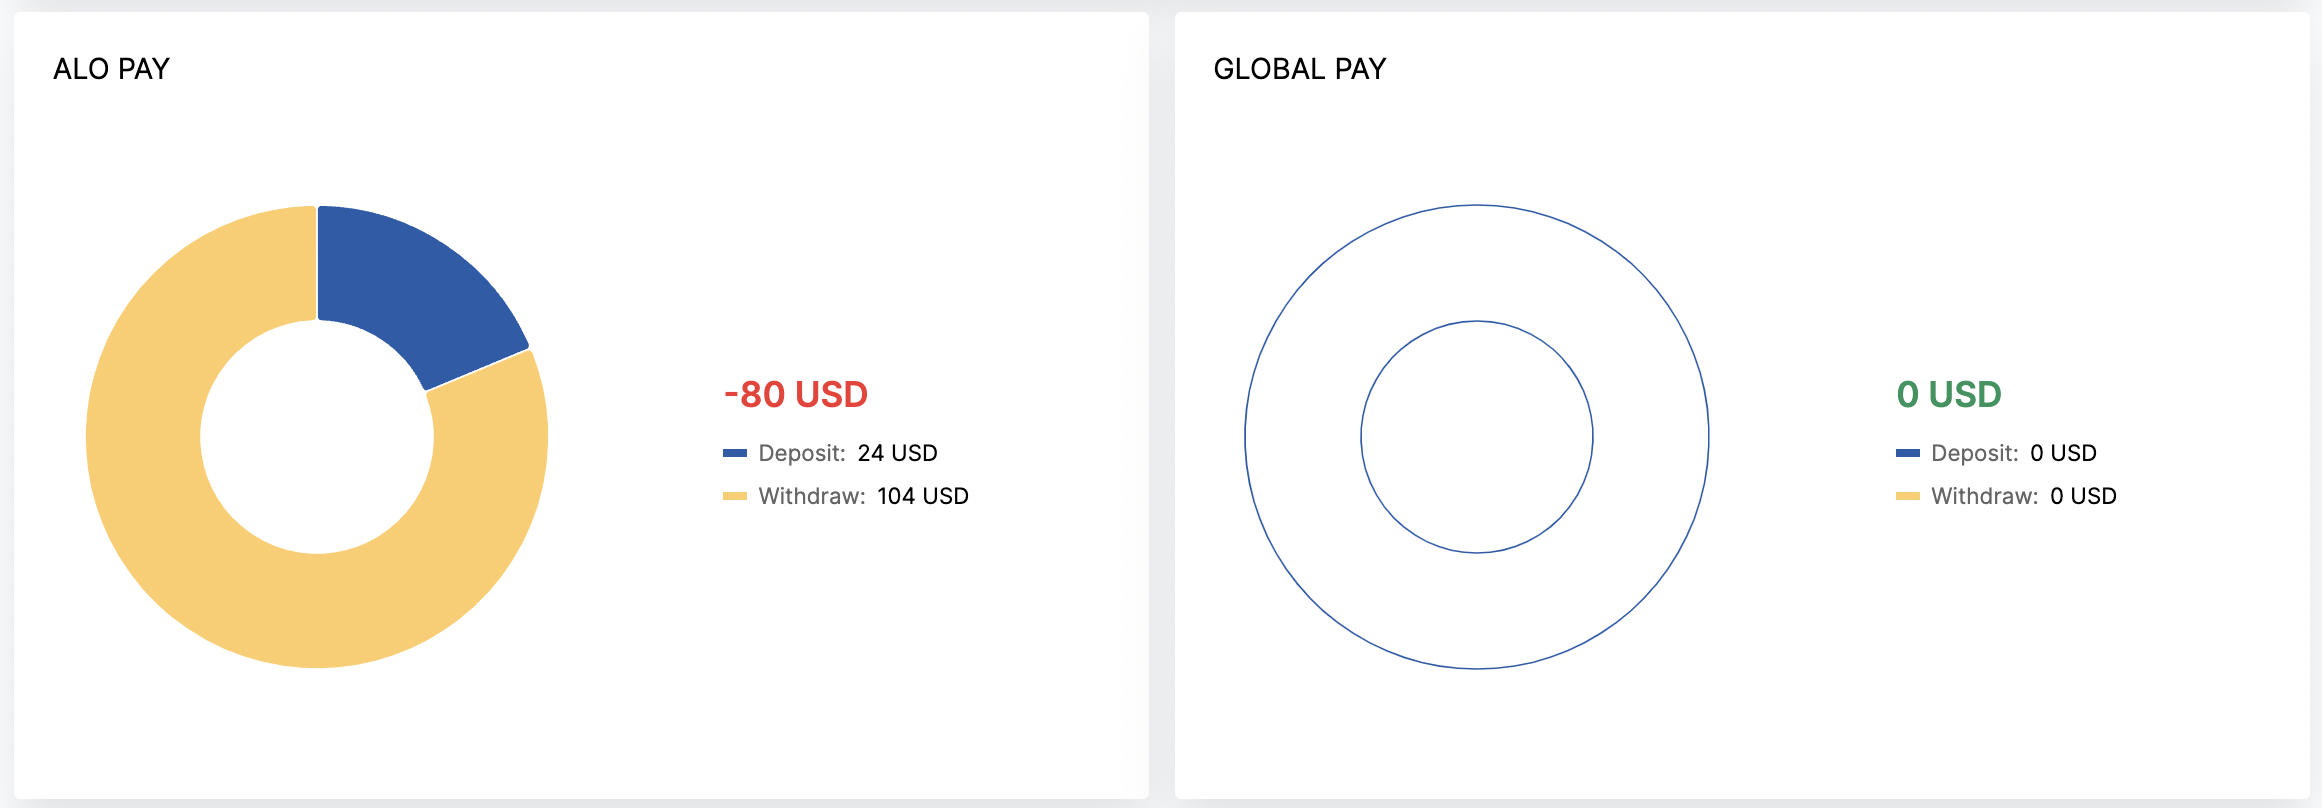 Nautilus able to support multiple Payment providers just in few steps.
In the Provider section, Operator can see the individual revenue of every single provider to anlyse the provier's performance.
Overview
Performance Overview
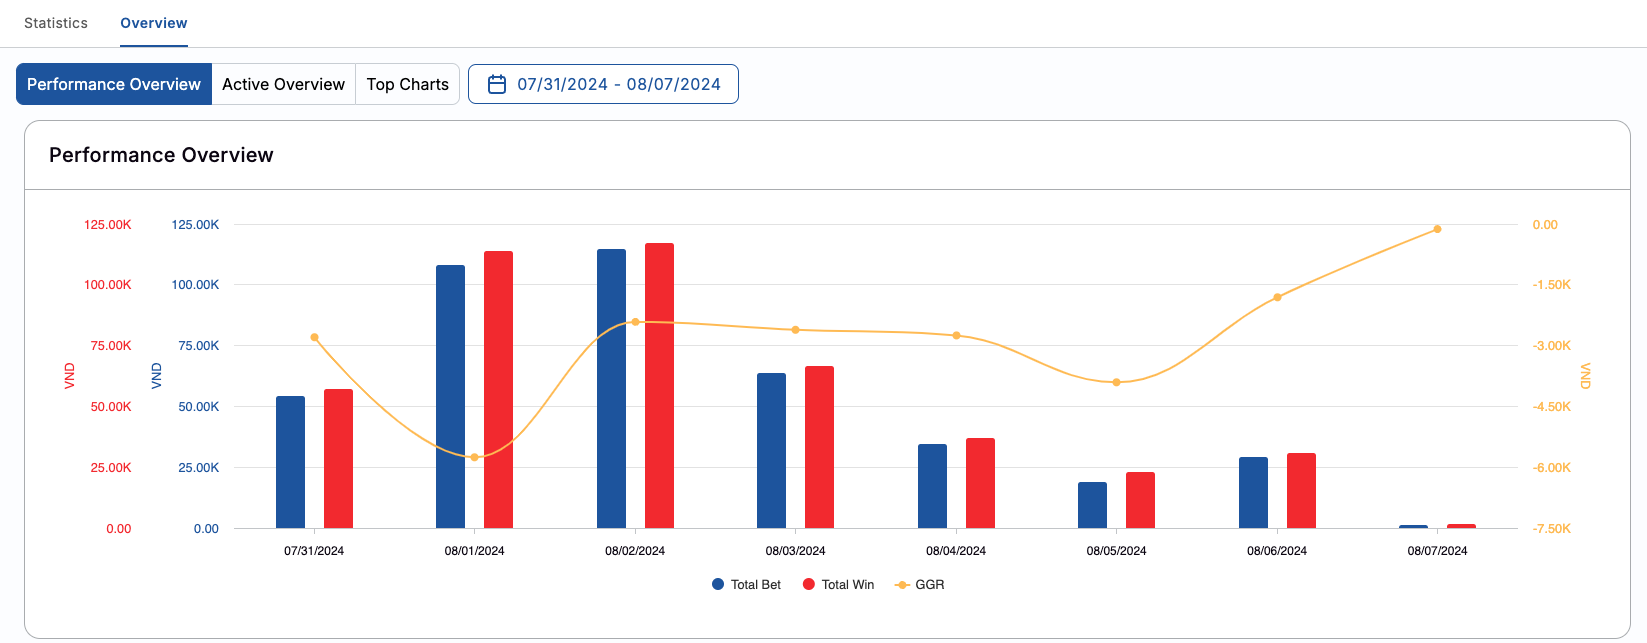 The Performance Overview will focus on 3 main information:
- Total Bet
- Total Win
- GGR
According to these 3 numbers, Operator can realise the current business performance.
Active Overview
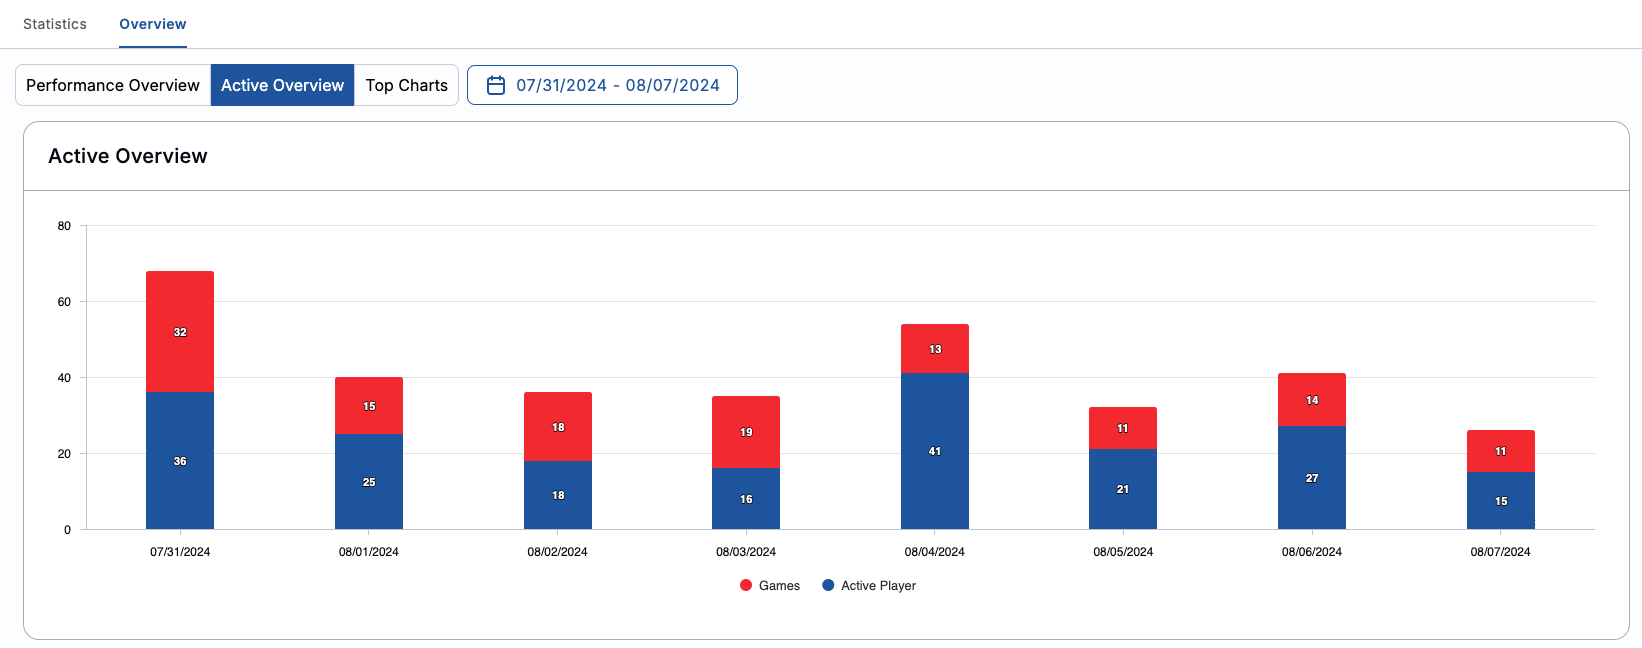 The Active Overview displays the total:
- Number of Active Players: the current Players who have betting activity currently.
- Number of Games: the games which have been bet by Active Players.
With this data, the Operator can know:
- When is the most crowded time
The date time filter supports the Operator efficiently in browsing data.
Top Charts
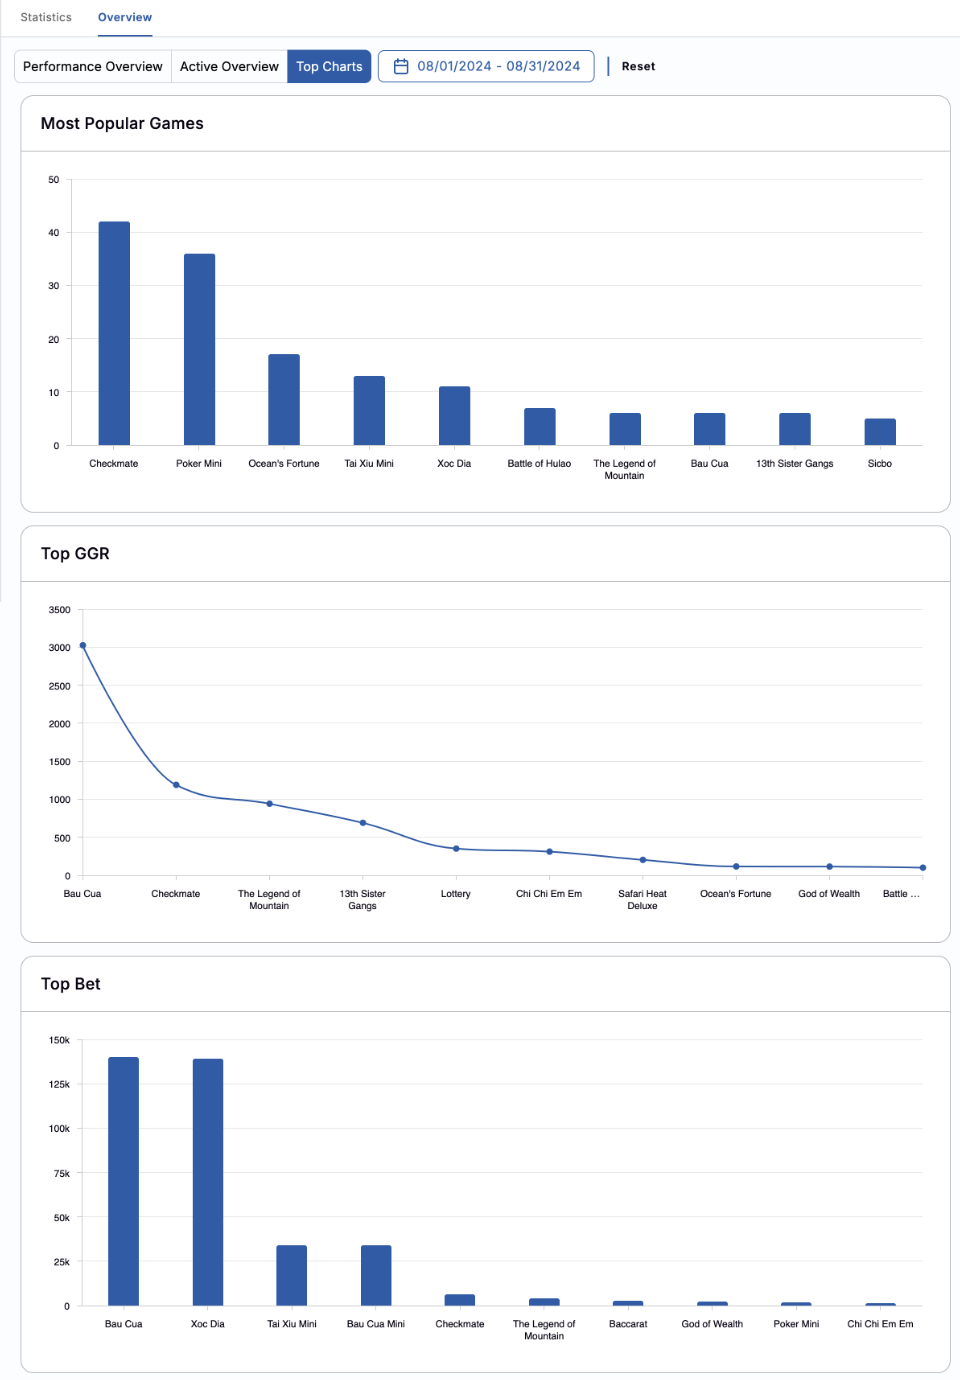 There are 3 main charts in this section:
- Most Popular Games: which games have been played the most.
- Top GGR: which games have the highest GGR.
- Top Bet: which games gave the highest Bet.
The value from these 3 charts:
- Most Popular Games - The Operator can know the hotest games and prepare more Promotion, ...
- Top GGR - The Operator can know the most earning games
- Top Bet - The Operator can know the games that made Players spent a lot of money
Beside the Date time filter, Operator can select the Top filter with: 10, 15, 20 or All of games.